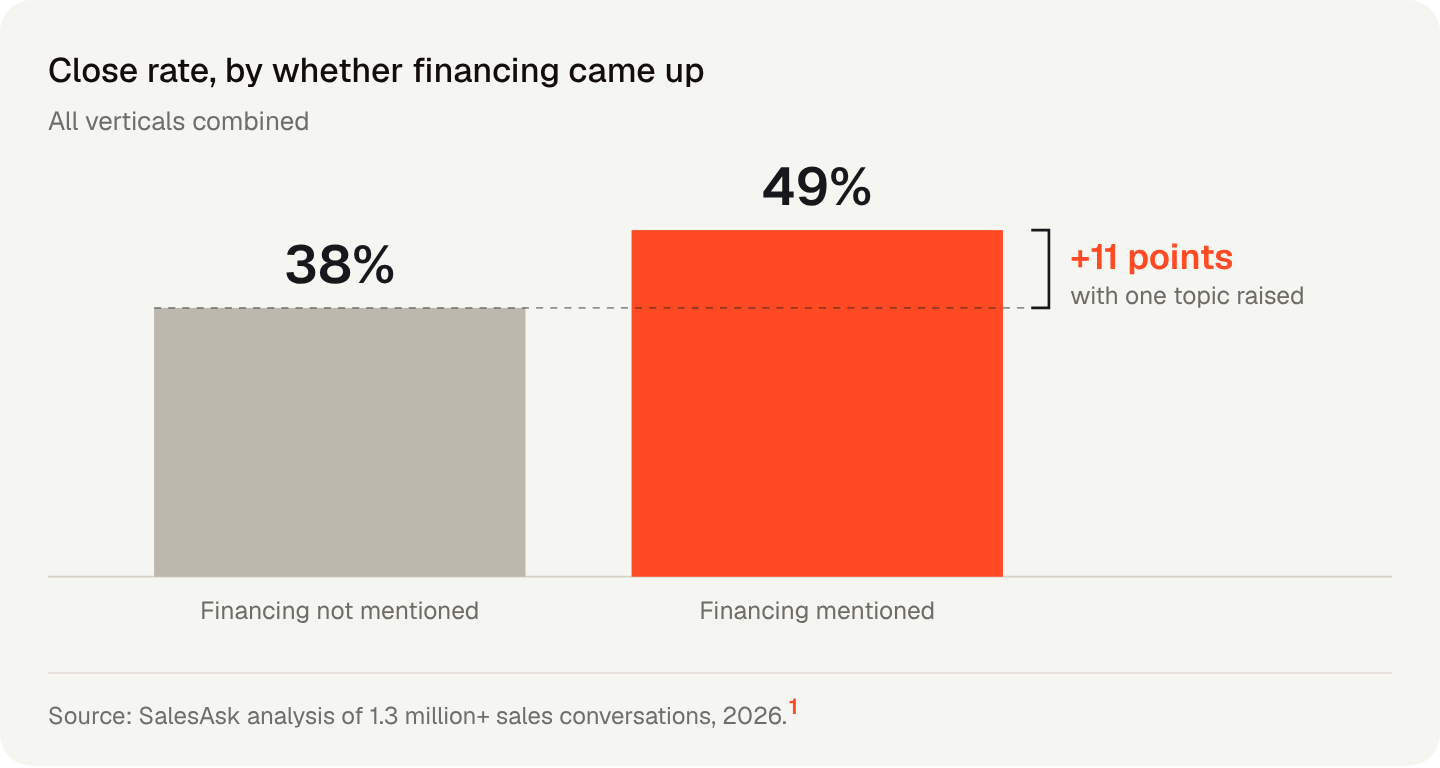
Mention financing and close rates go from 38% to 49%
What 1.3 million+ sales conversations show about how roofs, kitchens, furnaces and new homes get sold, next to the outside research that backs it up or argues with it.

What is the biggest single difference in the room?
Whether anyone mentions financing. Appointments where it comes up close at 49%; appointments where it doesn't close at 38%.1
Picture the end of a furnace quote at 7 pm. The number is on the table and the homeowner is doing math in their head. Some reps fill that silence with the warranty. Some talk about the monthly payment. The second group closes more often.
Federal housing data shows how seldom it happens. Harvard's Joint Center for Housing Studies, working from the Census Bureau's American Housing Survey, found that only 2% of 2023 home improvement projects were paid for mainly with contractor-arranged financing. 76% were paid for mainly with cash.2 The rest of that story, and the caveat that comes with it, is in Chapter 02.
Three chapters, each one a different part of the sale

Benchmarks
The 25 to 35 point rep gap, how long appointments run in 11 trades, the 48-minute spread between reps at the same company, and a calculator for your own numbers.
The Conversation
The eleven-point financing sentence, how many quotes the homeowner is holding, and what makes them pick one.

After the Table
Follow-up speed, text versus call, reviews, the three-day cooling-off window and recording consent.
How do I read the numbers?
Every figure carries a label and a numbered source.
Where our data doesn't cover something yet, we say so and show the best public number instead. Each chapter ends with what we're measuring next. Those cuts replace the outside numbers as they land.
About this data
SalesAsk figures come from two places: 1.3 million+ sales conversations analyzed across home services, home improvement and home builders, and this edition's sample of 80,887 in-person appointments recorded in the SalesAsk app by 1,763 reps at 255 companies between March 13 and October 11, 2026. No company, rep or homeowner can be identified from them. The 38% to 49% comparison is a correlation; Chapter 02 explains the test that comes next. Each chapter lists every outside source it uses, with dates and links.
Sources on this page
- SalesAsk, The Kitchen Table Report 2026: analysis of 1.3 million+ recorded sales conversations across home services, home improvement and home builders.
- Joint Center for Housing Studies of Harvard University, Improving America's Housing 2025, March 2025. JCHS tabulations of the U.S. Census Bureau and HUD 2023 American Housing Survey, a federal household survey. jchs.harvard.edu (PDF)
Ready to convert
every conversation?
See exactly what’s holding your team back and fix it fast.
.avif)