The Kitchen Table Files: The Rep Gap
On this page
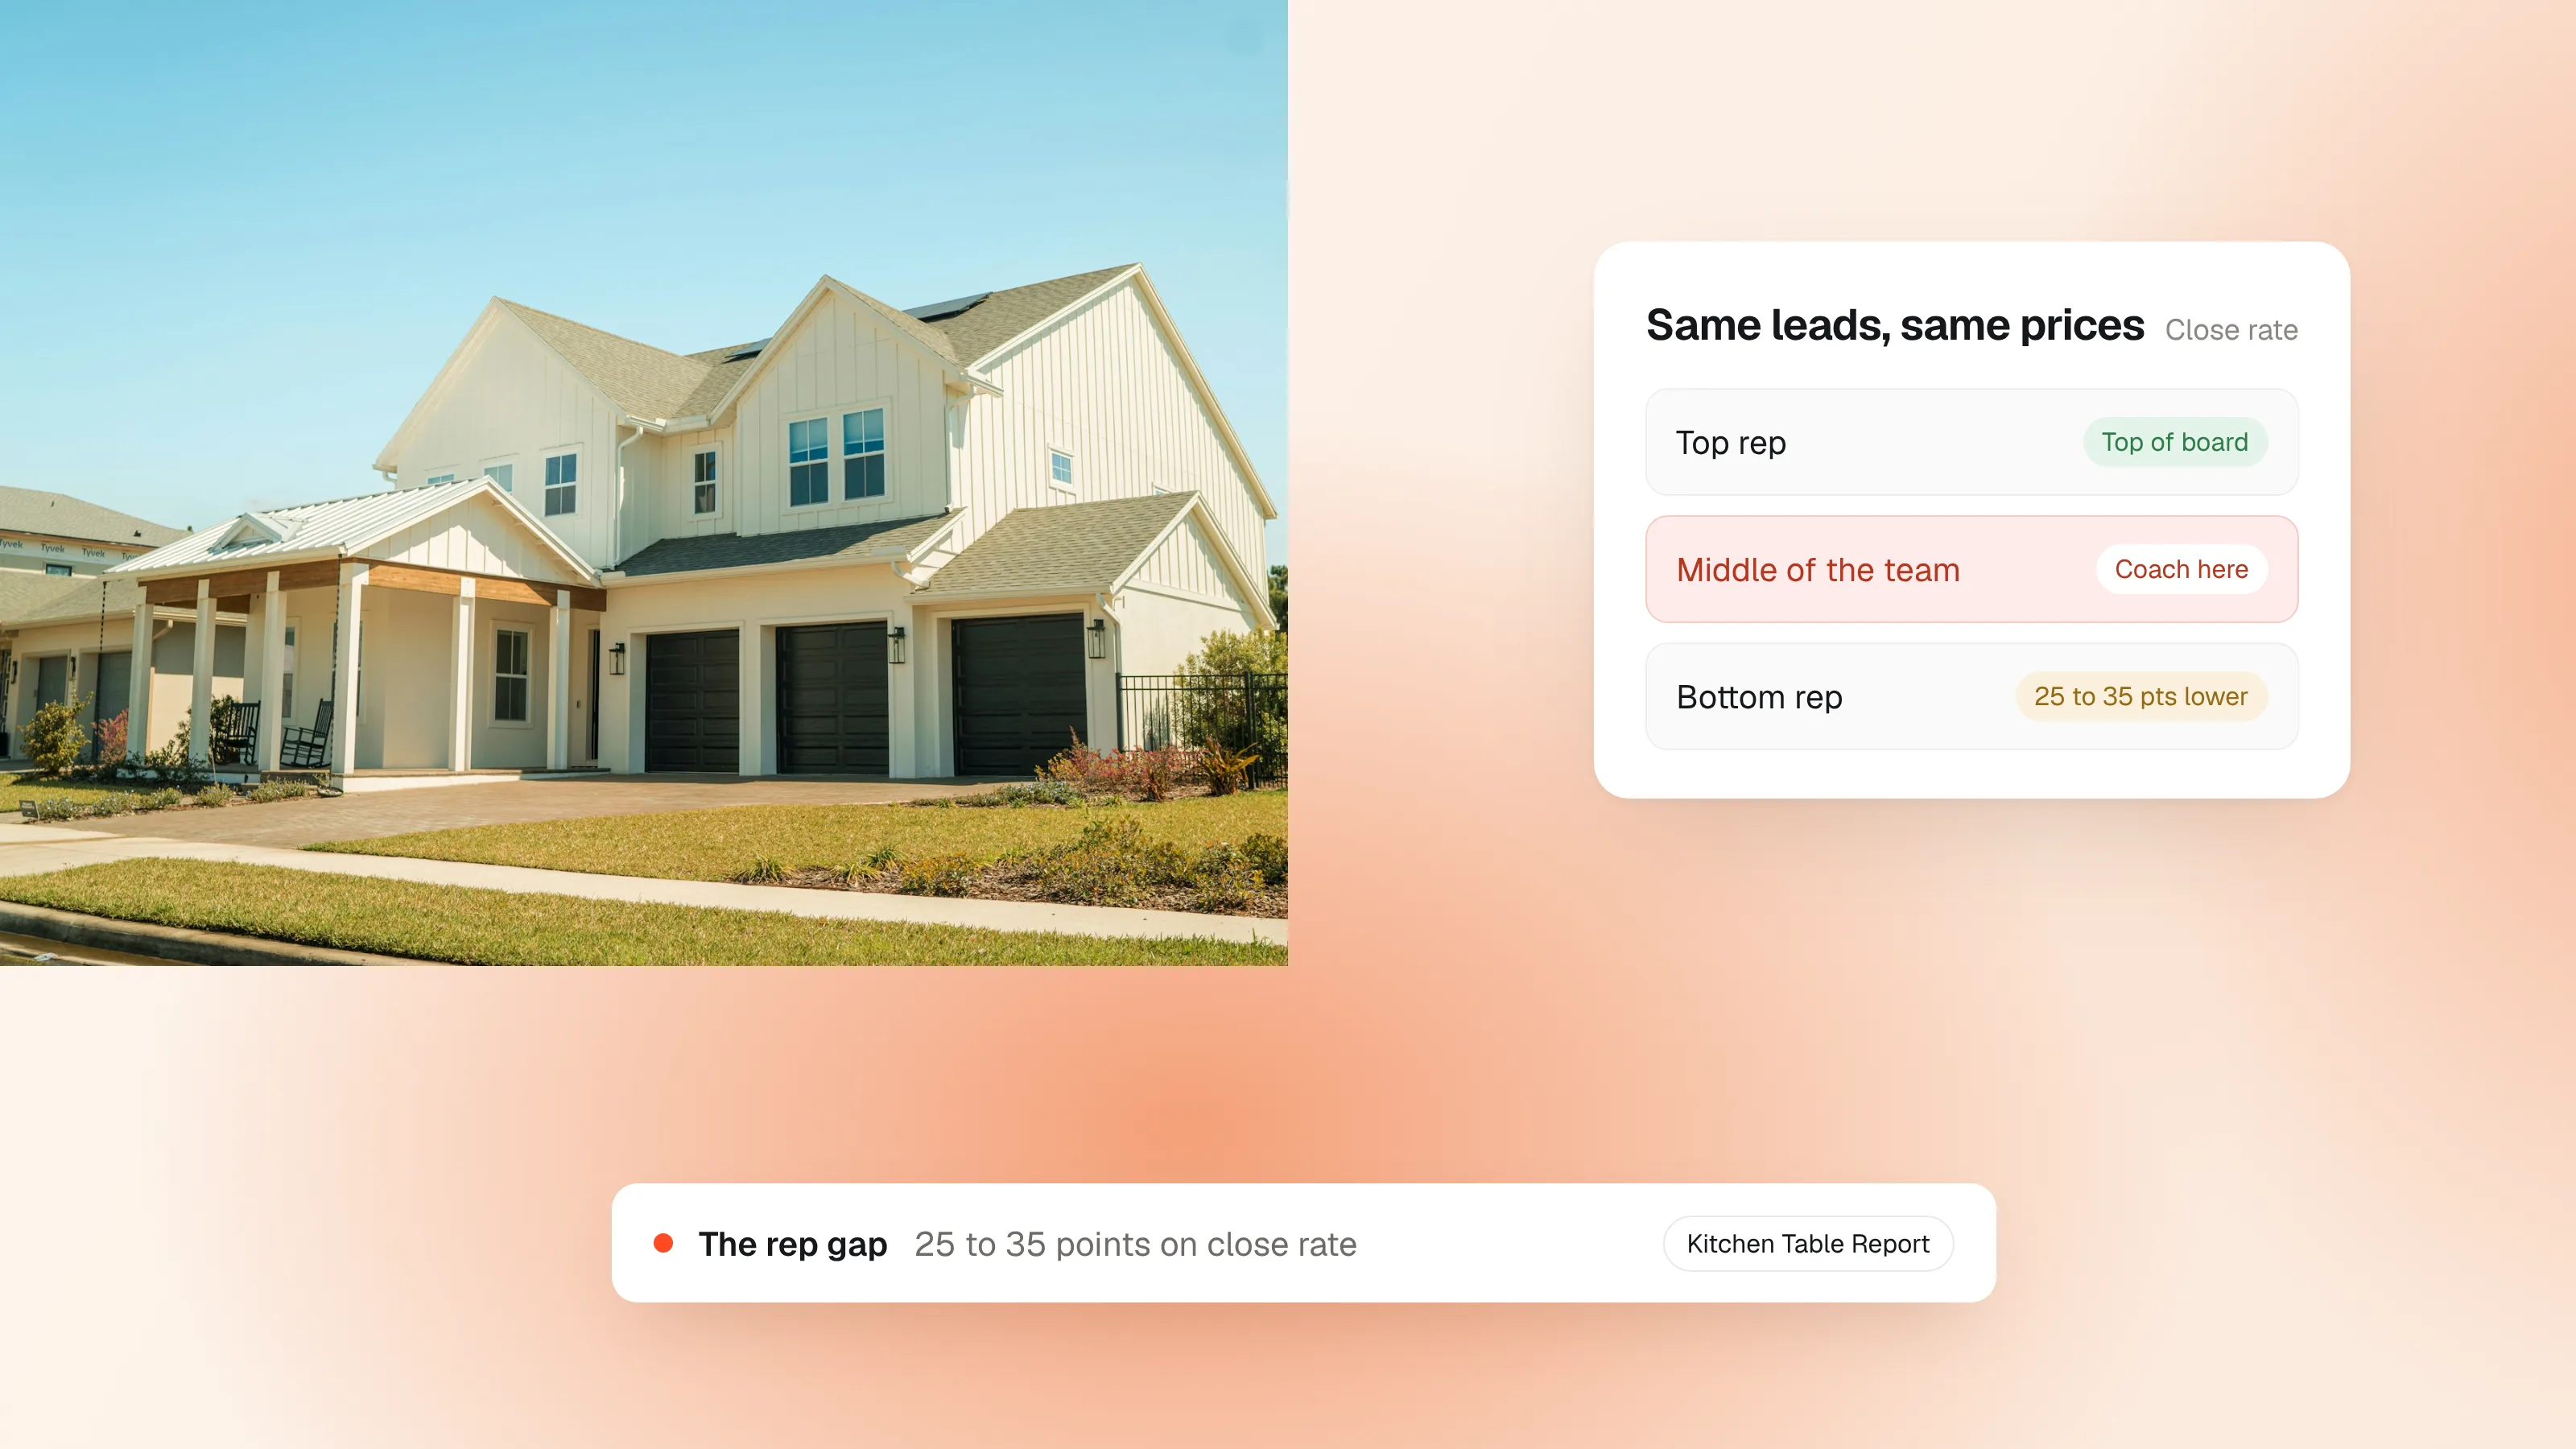
The best and worst reps on an in-home sales team sit 25 to 35 points apart on close rate, according to SalesAsk's analysis of 1.3 million+ sales conversations. For a 10-truck operation the full gap is worth about $585,000 a year, from appointments the company already pays to run. This entry in the Kitchen Table Files is for owners who rank reps on a whiteboard and have never heard two of them sell.
Key takeaways
- 25 points is the low end of the gap. On a team averaging in the thirties, the top rep closes roughly twice as often as the bottom rep.
- $585,000 a year for 10 trucks is a ceiling. Closing a third of the gap is still roughly $195,000.
- Reps at the same company don't run the same appointment: at the median company, the longest and shortest differ by 48 minutes.
- The return is in the middle of the team, on habits your top rep already shows on a recording.
- Lead mix explains some of the gap. Compare reps on the same lead types before judging anyone.
How wide is the gap between your best and worst rep?
It is 25 to 35 points on close rate, across the conversations SalesAsk analyzed. Twenty-five is the low end. Put a 25-point gap on a team whose average sits in the thirties, and the rep at the top closes roughly twice as often as the rep at the bottom.
Owners tend to guess lower, for a simple reason. Nobody has watched both reps sell. The monthly board is the only evidence, and it arrives too late to explain anything.
The spread isn't unique to home services. In a 2020 RAIN Group study of 472 respondents at B2B sales organizations, the top 7% won 73% of proposals and the bottom 80% won 40%. Those are whole organizations and not single reps, but the size of the gap looks familiar.
What does the gap cost in dollars?
About $585,000 a year for a 10-truck operation, or $58,500 per truck, in the Kitchen Table Report's estimate. That money comes from appointments already on the calendar. No new leads and no new hires.
Treat it as a ceiling. Nobody closes the whole gap, and I'd be suspicious of anyone who promised it. A third of it is still roughly $195,000.
To run it on your own numbers, use the report's worked example. It takes $10,000, the median homeowners reported spending on roofing in the Census Bureau's 2023 American Housing Survey, and closes 10 points of the gap.
| Line | Example |
|---|---|
| Appointments a month | 40 |
| Months | 12 |
| Points of gap closed | 10 |
| Extra jobs a year | 48 |
| Average ticket | $10,000 |
| Extra revenue a year | $480,000 |
Swap in your own appointment count and average ticket. One extra point is worth very different money on a water heater and on a kitchen.
Why does the gap persist year after year?
Because what creates it is invisible. Both reps leave the shop with the same price book, and everything that separates them happens in a living room nobody else sees.
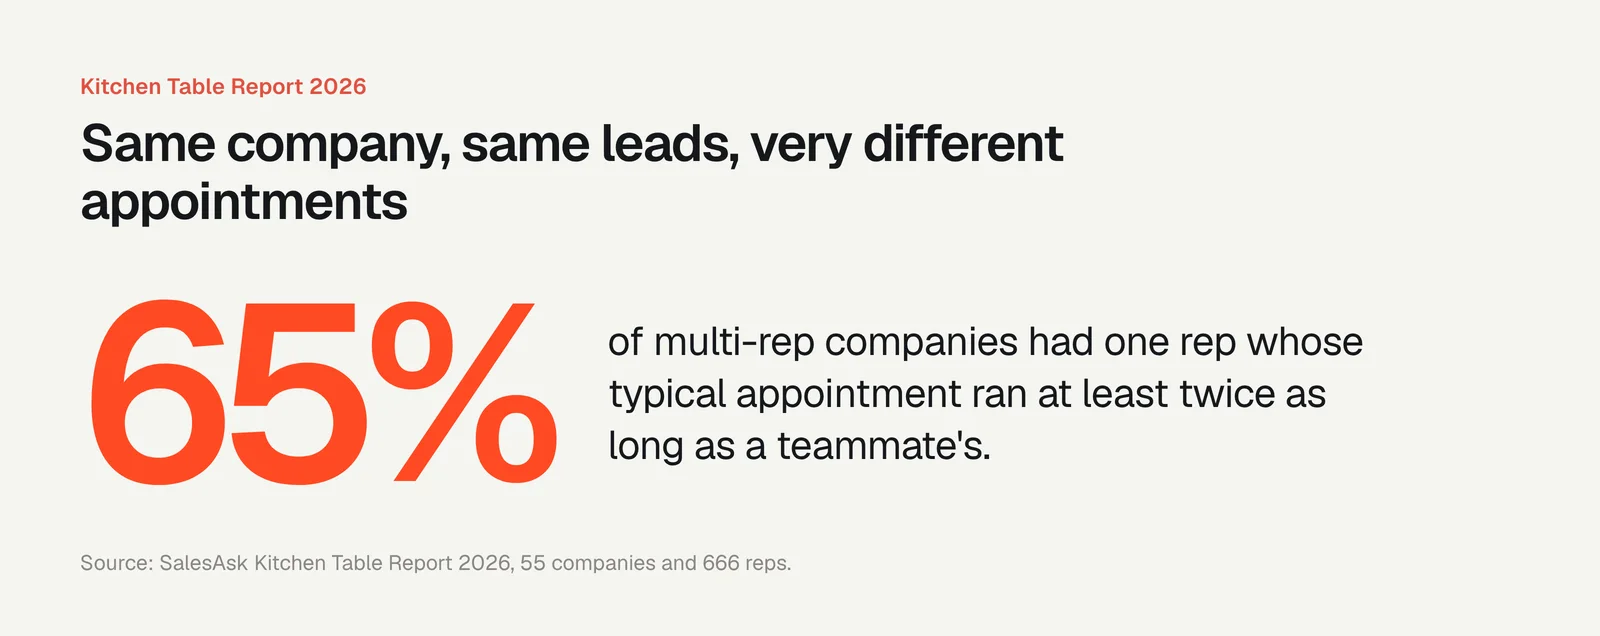
The appointment data shows how different those living rooms are. The report looked at 55 companies with at least four reps who each recorded 20 or more appointments. At the median company, the rep with the longest appointments ran 48 minutes longer than the rep with the shortest. At 65% of them, one rep's typical appointment was at least twice as long as another's. Length isn't skill, but two reps who differ by 48 minutes aren't following the same process.
One habit is measured. Appointments where financing came up closed at 49%, against 38% where it never did. That is a correlation, and better reps may raise financing more. It is still a habit you can hear on a recording and coach by Thursday.
Lead mix explains part of the gap. Senior reps often get the warm referrals and new reps get the marketed leads. Split your numbers by lead type before you draw conclusions about anyone.
How do you narrow it?
Coach the middle of the team on the three or four habits your own top rep already shows on a recording, with SalesAsk scoring every visit against those steps. The star is fine. The return is in the reps one or two habits away from a better month.
Recording is what makes the coaching specific. You aren't telling a rep to be better. You are playing him the minute where his appointment and the top rep's went different ways.
- Load the steps your top closer follows as the scorecard.
- Look at the heatmap for the step the middle of the team skips most.
- Have those reps practice that step in an AI roleplay before their next appointment.
- Turn on live coaching during the visit if you want it, and read the written feedback after.
- Check the same step again in two weeks.
Good places to start are the financing mention and a second and third option. To see the gap on your own team, book a SalesAsk demo.
What hasn't been measured yet?
The gap per trade, and whether companies with above-median close rates still carry it. Both are on the Kitchen Table Report's list of cuts to publish. So is the link between appointment length and outcome.
We also can't tell you how fast the gap narrows with coaching across many teams. Published customer results vary by company, and each story says so.
Frequently asked questions
Is a 25-point gap normal or a sign of a broken team?
It is common, which is the problem. In SalesAsk's data, 25 points is the low end of what separates top and bottom reps. The teams that narrow it look at behavior on recordings and not only at the scoreboard.
Should I replace the bottom rep?
Do the math first. A new hire arrives with a new hire's close rate and learns your process during live appointments. Coaching a few points out of the reps you have is often the cheaper route.
Does the gap show up in average ticket too?
We haven't published that cut. Close rate and median ticket by trade are both on the report's list. Track ticket by job type alongside close rate so a rep can't improve one by quietly shrinking the other.
Where can I see the full data?
In the Benchmarks chapter of the Kitchen Table Report, which has the method and the calculator.
Sources
- SalesAsk, The Kitchen Table Report 2026, Benchmarks: analysis of 1.3 million+ sales conversations, plus 80,887 in-person appointments recorded by 1,763 reps at 255 companies, March 13 to October 11, 2026. It cites the RAIN Group study and the Census Bureau's 2023 American Housing Survey.
- SalesAsk, The Kitchen Table Report 2026, The Conversation, for the financing close rates.
Dara Shabnam
Leads growth at SalesAsk and writes about in-home sales training and recording consent.
More posts byWritten by the SalesAsk team
SalesAsk records and coaches in-home sales conversations for home service, home improvement and home builder teams.
More posts