The Seven-Number Scorecard for In-Home Sales Teams

On this page
Track seven numbers for an in-home sales team: close rate by lead source, average ticket by job type, recording coverage, options presented, financing mention rate, unforced discount rate and homeowner talk share. Two are outcomes and five are behaviors a manager can coach before Thursday's appointments. The best and worst reps at a company sit 25 to 35 points of close rate apart in SalesAsk's 2026 data, and a revenue leaderboard doesn't show why.
Key takeaways
- Revenue blends lead quality, territory, job mix and luck. It mostly shows who was handed the best appointments.
- Keep two outcome numbers for orientation and spend the rest of the scorecard on behaviors.
- Appointments where financing came up closed at 49%, against 38% where it didn't, in the Kitchen Table Report.
- Recording coverage comes first, because every behavior number is only as good as the share of visits recorded.
- Pay on outcomes and coach on behaviors. A behavior that becomes a quota gets gamed.
Why is a revenue leaderboard a bad scorecard?
Because revenue mixes lead quality, territory, job mix, season and luck into one number. Think about what sits inside a rep's monthly figure: which lead sources were routed to them, whether their territory has older houses with bigger tickets, whether a hailstorm landed in their zip codes.
Close rate is better, and it still gets misused. A rep closing nearly half of their referral leads isn't outperforming a rep closing a third of their paid internet leads. They're on the same whiteboard playing different games.
The spread is the tell. In SalesAsk's analysis of 1.3 million+ sales conversations, the gap between reps at the top and bottom of the board ran 25 to 35 points of close rate. Put a 25-point gap on a team averaging in the thirties and the top rep closes roughly twice as often as the bottom one. That difference comes from what gets said in the home, and revenue measures it last.
What should the scorecard measure instead?
Mostly behaviors, because a manager can coach a behavior this week and can do nothing about last month's result.
| Outcome metrics | Behavior metrics | |
|---|---|---|
| Examples | Revenue, close rate, average ticket | Options presented, financing mentioned, discounts volunteered, talk share |
| What they answer | Who ended up ahead | What each rep does differently in the home |
| Lag | Weeks to months | Visible after one appointment |
| Coachable | No | Yes, before the next appointment |
| Gaming risk | Low, but invites excuses | Real. Pair every behavior with an outcome |
Which seven numbers earn a spot?
Two outcomes for orientation, then five conversation behaviors.
1. Close rate, cut by lead source
Keep it, and never read it raw. One line per lead source per rep. Cut this way, some "weak" reps turn out to be carrying the hardest lead bucket in the company.
2. Average sold ticket, cut by job type
A rep can post a strong close rate by quietly selling the small, safe scope on every job. Ticket by job type catches it. Read the first two numbers together, because either one alone rewards a different bad habit.
3. Recording coverage
The share of appointments that produce a recording you can review. If a rep records four appointments out of ten, you're coaching their highlight reel. The appointments a rep chooses not to record are rarely random.
4. Options per proposal
How many distinct options the homeowner heard before seeing a price. One option turns the conversation into a yes or no vote on a single number. In a 2025 Thrive Analytics survey of more than 1,000 contractors for ServiceTitan, 54% of thriving businesses gave three options on at least half their jobs, and struggling businesses did so on fewer than 10%. That links options to healthy businesses, not to close rate on one appointment.
5. Financing mention rate
The share of appointments where payment options get said out loud. In the Kitchen Table Report, appointments where financing came up closed at 49%, against 38% where it never did. It is a correlation, and reps who raise financing may be better reps in general. It is still the cheapest behavior on this list to check.
6. Unforced discount rate
How often a rep drops the price before the homeowner asked. In recordings you can hear it happen, usually right after a silence the rep couldn't hold. We don't have a published number for how common it is. I include it because every unforced discount comes straight out of margin.
7. Homeowner talk share
What fraction of the conversation is the homeowner's voice. I won't give you a target. Gong's 2025 analysis of 326,000 B2B sales conversations found reps talked 57% of the time in deals they won and 62% in deals they lost, but those weren't kitchen tables. A kitchen and bath consultation with a 73-minute median and a plumbing visit with a 37-minute median shouldn't share a threshold. Track the trend per rep.
How do you collect this without a clipboard on every job?
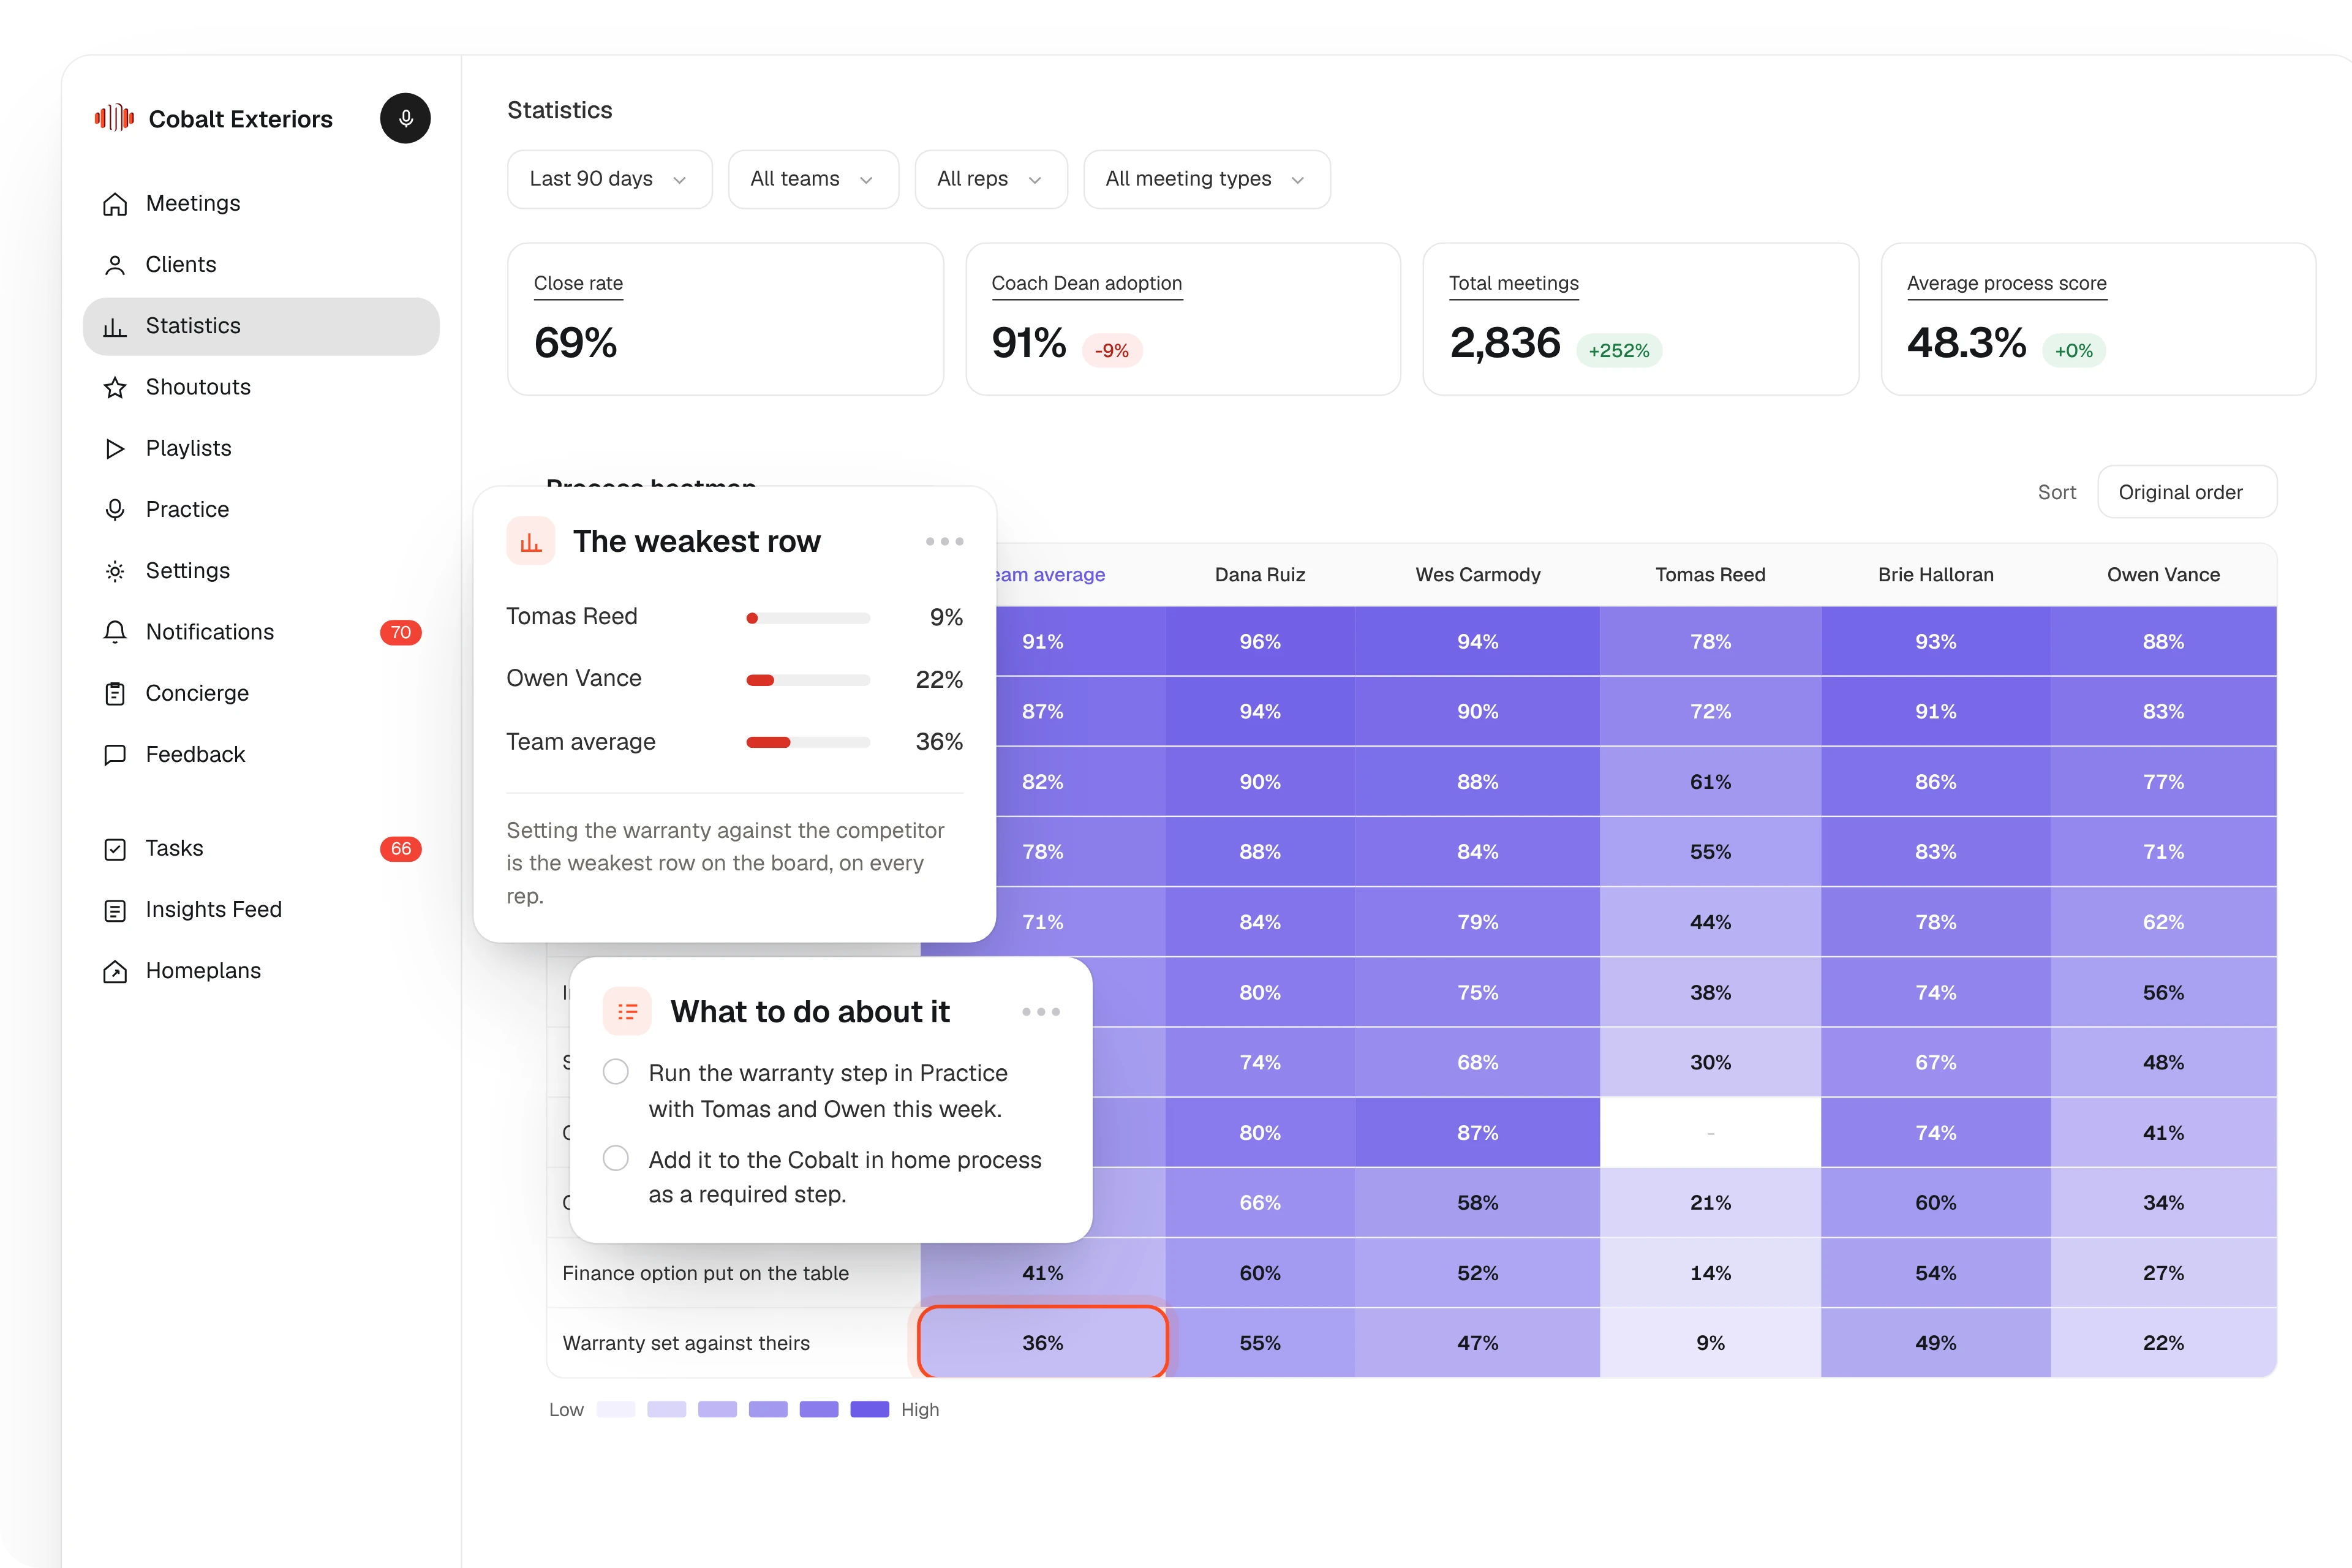
Record the appointment with SalesAsk, and most of the scorecard comes out of the recording. Each visit is scored against your own sales steps, so "presented three options" and "raised financing" are marked hit, partial or missed with the minute they happened.
Self-reporting fails quietly. Nobody writes "I panicked and knocked a thousand off" in the CRM. Ride-alongs work and top out at one manager, one rep, one day.
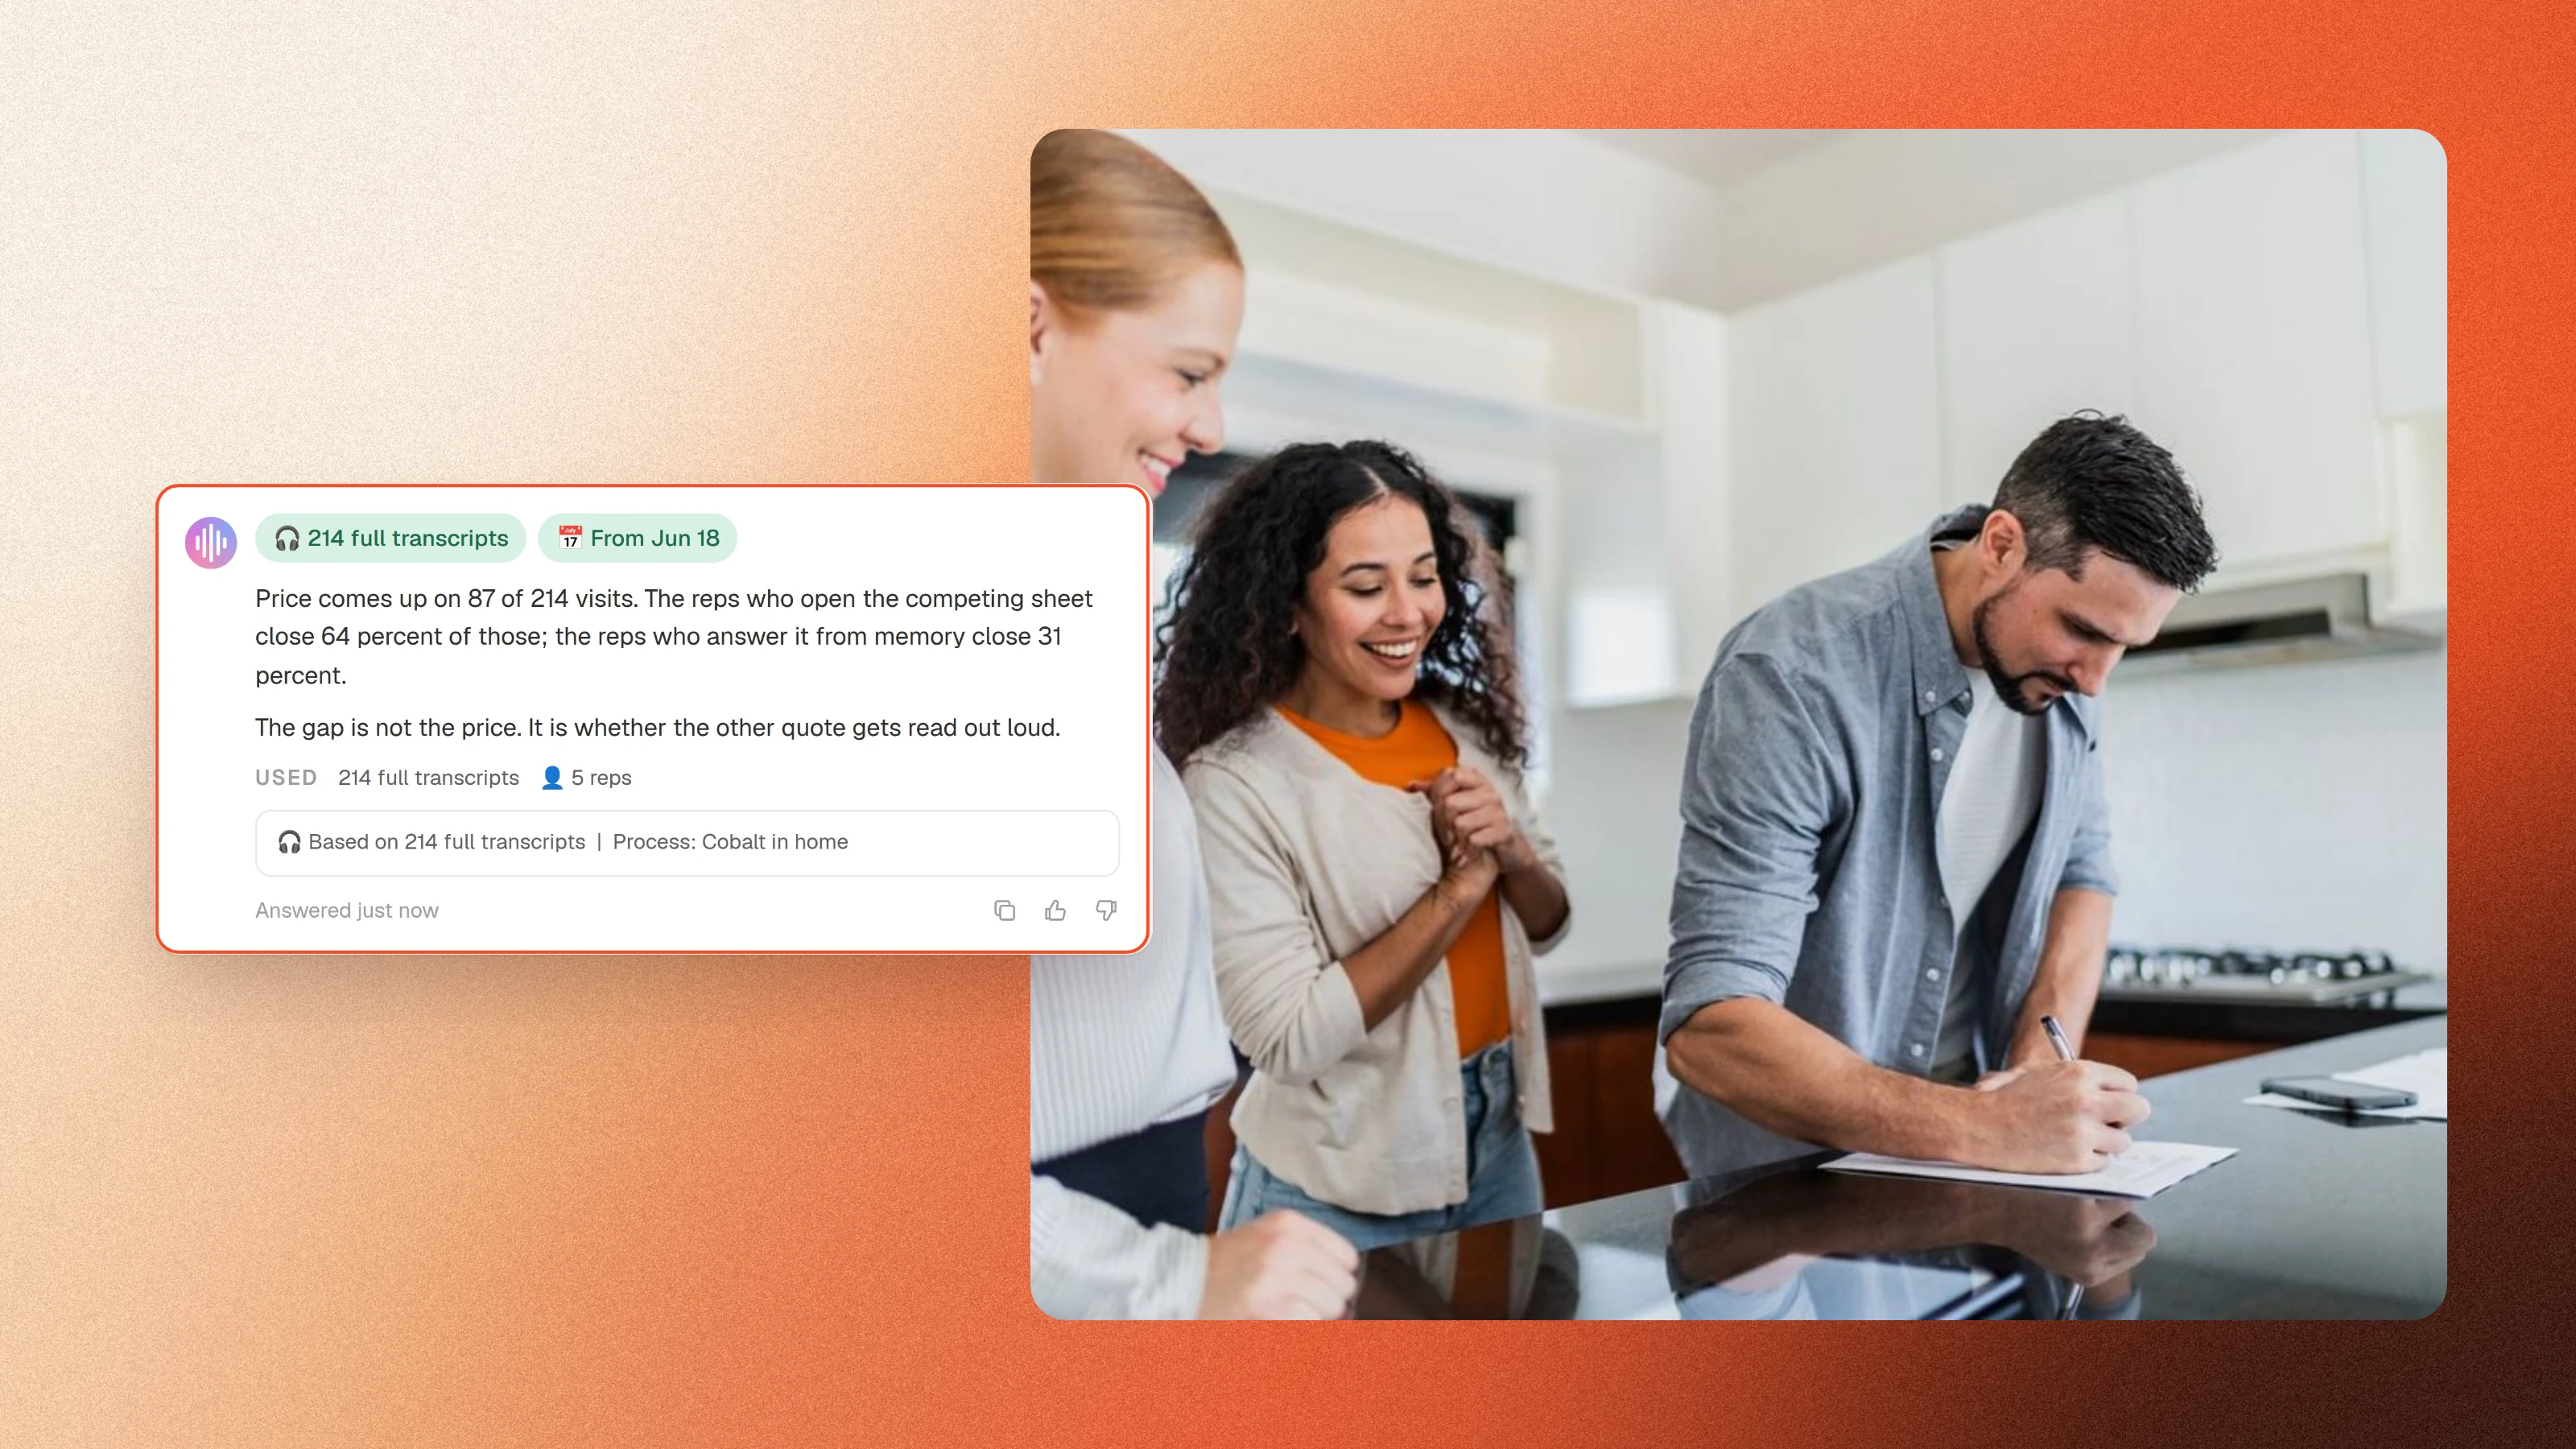
The scorecard feeds coaching at three points: an AI roleplay on the missed step before the next appointment, optional live coaching during it, and written feedback afterward. A manager can also ask Coach Dean which reps skip financing and get an answer that cites the visits. On a team of three or four reps, sampling recordings by hand gets you much of the same signal and costs evenings.
Two cautions. Reps resist recording at first, and the resistance is mostly fear of embarrassment, so lead with coaching. And some states require everyone's consent to record, so disclose on every visit. Our state recording guide has the list.
Where does a scorecard like this go wrong?
It goes wrong the moment a behavior number becomes a quota. Tie a bonus to financing mention rate and you'll get reps mumbling "we also have financing" on their way out the door. Punish low talk share and you get performative silence.
Keep behaviors in the coaching conversation and keep money tied to outcomes. A scorecard also can't fix bad leads, a broken price book or a rep who shouldn't be in sales. It tells you which problem you have.
If you want a sense of the stakes, the Kitchen Table Report puts the full rep gap at $585,000 a year for a 10-truck operation. Treat that as a ceiling. Nobody closes the whole gap. To see your own steps scored, book a SalesAsk demo.
Frequently asked questions
What is a good close rate for in-home sales?
There isn't one universal benchmark, because lead source and trade move the number more than skill does. The figure that matters is the spread inside your own team on comparable leads. Our close rate benchmarks guide goes through the published bands.
How many of a rep's appointments do I need to review?
Fewer than you'd think. Habits like unforced discounting or single-option proposals show up within a week of appointments. The mistake is judging a rep on one visit.
Should bonuses be tied to behavior metrics?
No. Pay on outcomes and coach on behaviors. The scorecard stops being useful for diagnosis the day it becomes a compensation document.
Where should I start?
With recording coverage and unforced discounts. The first makes every other number possible, and the second shows up in margin fastest. Add the other five once reviewing the scorecard feels normal to the team.
Sources
- SalesAsk, The Kitchen Table Report 2026, Benchmarks, for the 25 to 35 point rep gap, the $585,000 estimate and appointment lengths by trade.
- SalesAsk, The Kitchen Table Report 2026, The Conversation, for the financing close rates, and for its citations of ServiceTitan's 2025 Residential Trades Report (Thrive Analytics, 1,000+ contractors) and Gong Labs' talk ratio analysis (326,000 B2B conversations).
Dara Shabnam
Leads growth at SalesAsk and writes about in-home sales training and recording consent.
More posts byWritten by the SalesAsk team
SalesAsk records and coaches in-home sales conversations for home service, home improvement and home builder teams.
More posts